
Bitcoin Halving 2020 event is about to happen in around 2-3 weeks time in May 2020, what is the hype about the Bitcoin Halving 2020 event? What would it affect to the Bitcoin price? Investing in bitcoin may seem scary, please just know that it takes time and effort to understand how Bitcoin works, and then you can decide if this is for you.
In this article I will share with you some of my favourite metrics when it comes to choosing how much and when I invest into Bitcoin, my exit plan and money mindset about Bitcoin.
WHAT MAKES BITCOIN VALUABLE?
The total supply of Bitcoin is 21 million coins; this is mathematically designed into its algorithm. Every 210,000 blocks, or roughly every four years, the total number of Bitcoin supply get cut in half.
2009: the system started at 50 coins mined every 10 minutes.
2012: was cut to 25 Bitcoins every 10 minuets.
2016: 12.5 Bitcoins are currently being dispensed every 10 minutes.
In about 2-3 weeks time, May 2020, Bitcoin supply will be once again get cut in half, to 6.25 Bitcoin per block. After the 33rd halving, the value of the reward will hit precisely 0 BTC. 33 halving events every 4 years adds up to 132 years total. This process will end with a total of 21 million coins, probably in the year 2140.
There is no ‘CEO’ or ‘central banks’ of Bitcoin to ‘print more Bitcoins’ like how the Feds printing more money. This limited supply makes Bitcoin a scarce asset.
It is not possible to truly predict the price of Bitcoin, the below are some of the simple indicators that I chose to believe.
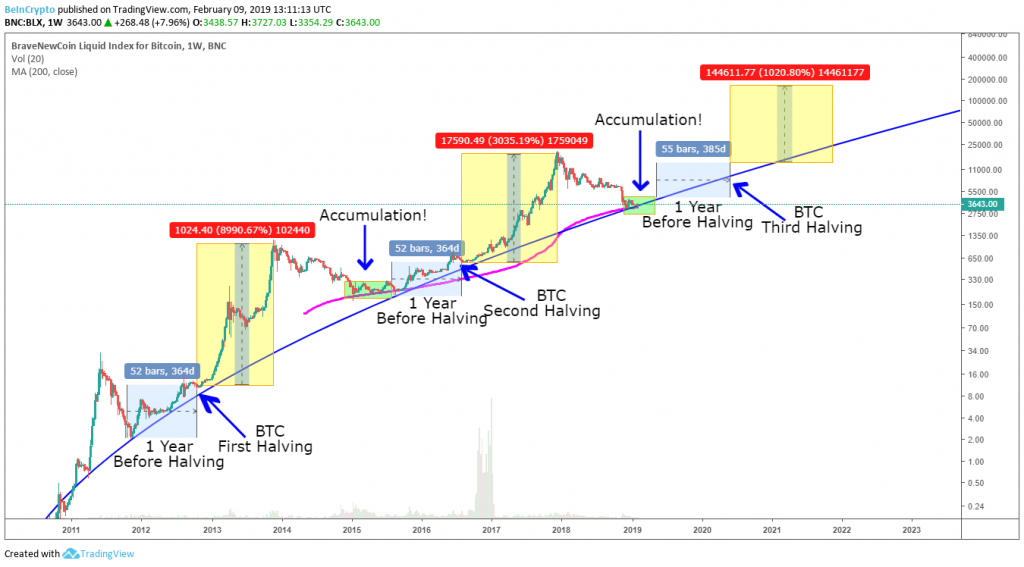
1. BITCOIN 4 YEAR CYCLE
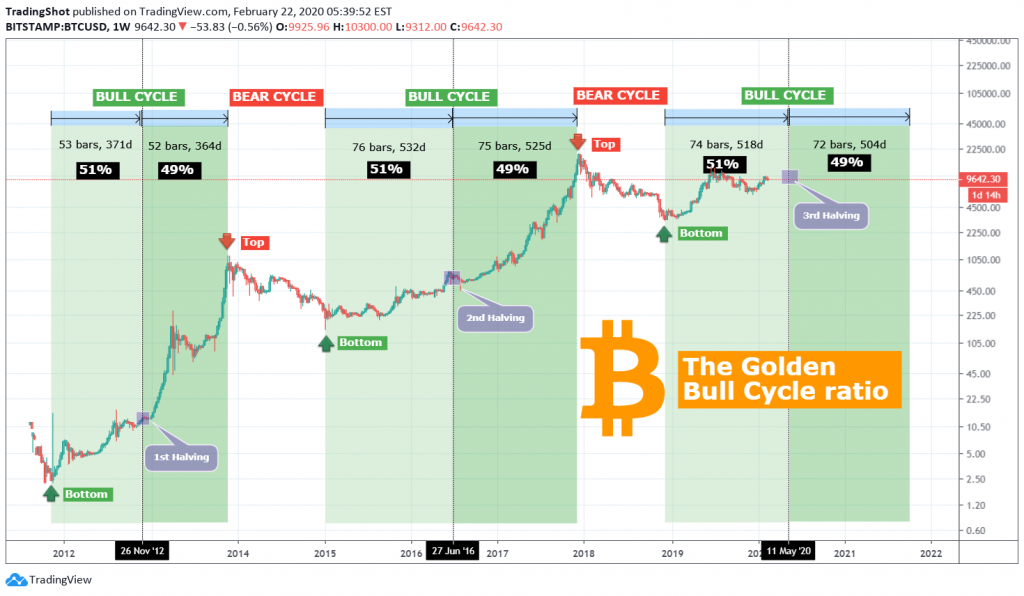
Bitcoin Halving’s have been important catalysts that bring about a new bull market for Bitcoin.
Let’s look at the last two halving and how it affected the price.
In 2012: Lowest around $10; All time high around $1,000, making that a healthy 9,900% increase
In 2016: Lowest around $200; All time high around $20,000, another happy 9,900% gain.
In 2020: Lowest around $3,000, where do you think it may take us? Possibly up to $300k maybe!?
Bob Lukas has an amazing 4 year cycle journey theory and I have been following him for a while.
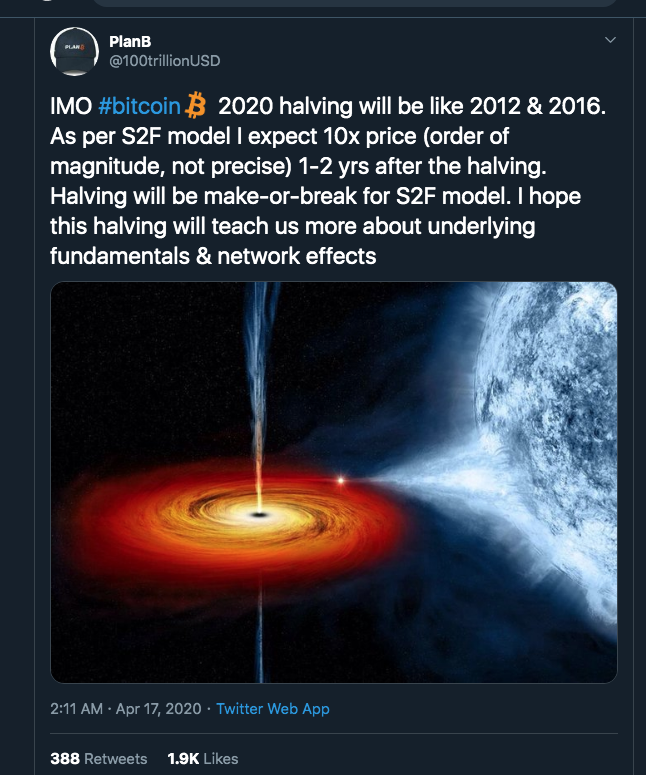
2. STOCK TO FLOW MODEL BY PLAN B
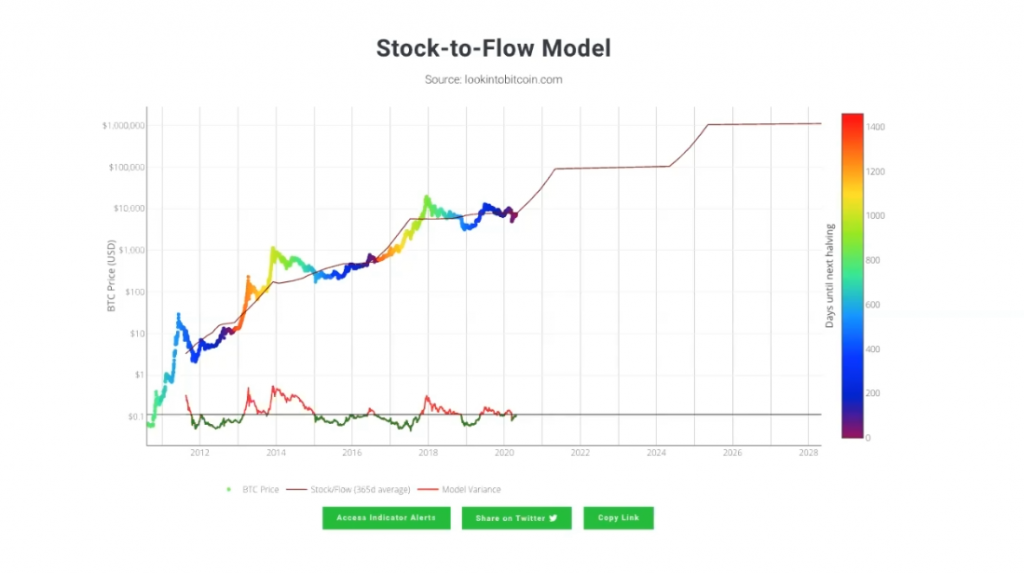
Created by Bitcoin analyst goes by the name of Plan B, Bitcoin stock to flow model treats Bitcoin as being comparable to commodities such as gold, silver or platinum.
These are known as ‘store of value’ commodities because they retain value over long time frames due to their relative scarcity. It is difficult to significantly increase their supply i.e. the process of searching for gold and then mining it is expensive and takes time.
Bitcoin is similar because it is also scarce. In fact, it is the first-ever scarce digital object to exist.
There are a limited number of coins in existence and it will take a lot of electricity and computing effort to mine the 3 million outstanding coins still to be mined, therefore the supply rate is consistently low.
According to the Stock to Flow model, Bitcoin is at the range of where it should be. You see how it tends to stay from double digit in the early days, to less than a thousand around the first halving, then at the 4 digit range all the way up to touch $20,000 in the 2nd halving.
Looking at the chart, looks like Bitcoin will be entering the 5 digit range and may not look back. Therefore many speculators out there keep acuminating Bitcoin now.
Knowing that there is a chance for Bitcoin to hit a 6 figure range in the next cycle around 2022.
3. Bitcoin Mayer Multiple
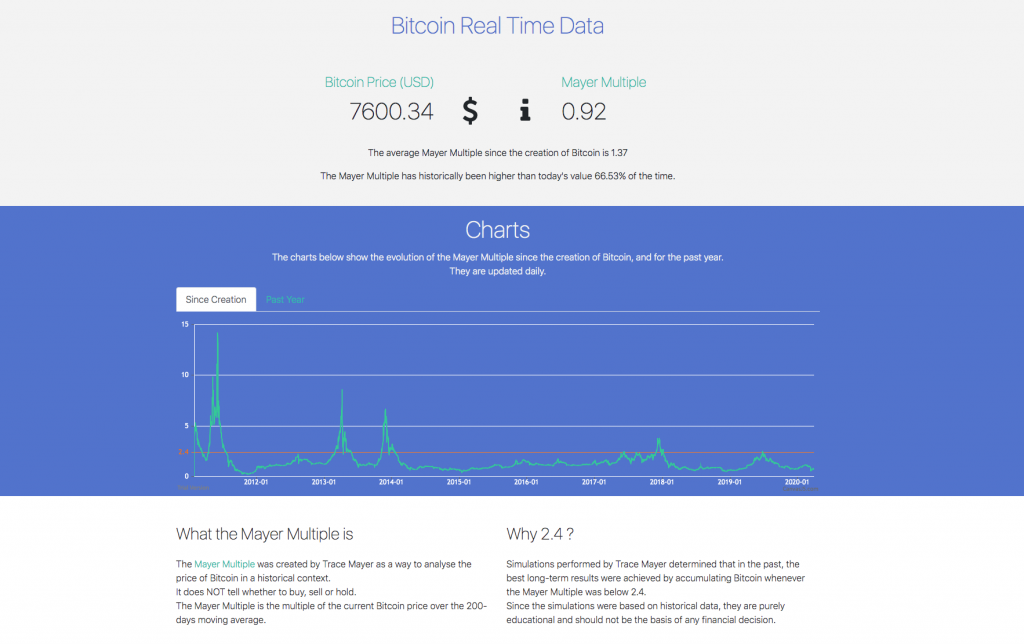
Next is Bitcoin Mayer Multiple chart, I use this one for a quick indication as to see if Bitcoin is within the cheap or expensive range.
The Mayer Multiple was created by Trace Mayer as a way to analyse the price of Bitcoin in a historical context. It does NOT tell whether to buy, sell or hold. But to give you an idea of where we are. The Mayer Multiple is the multiple of the current Bitcoin price over the 200-days moving average.
Simulations performed by Trace Mayer determined that in the past, the best long-term results were achieved by accumulating Bitcoin whenever the Mayer Multiple was below 2.4. Since the simulations were based on historical data, they are purely educational and should not be the basis of any financial decision.
If you look at the chart, anything under 1.37 is a good price. If I had study this chart before, I would take a break from buying at the end of 2017, when the number was going over 2, and peak at 3.5, indicated it was overbought and time to sell.
Today it’s around 0.92, pretty cheap.
4. Bitcoin Network Momentum
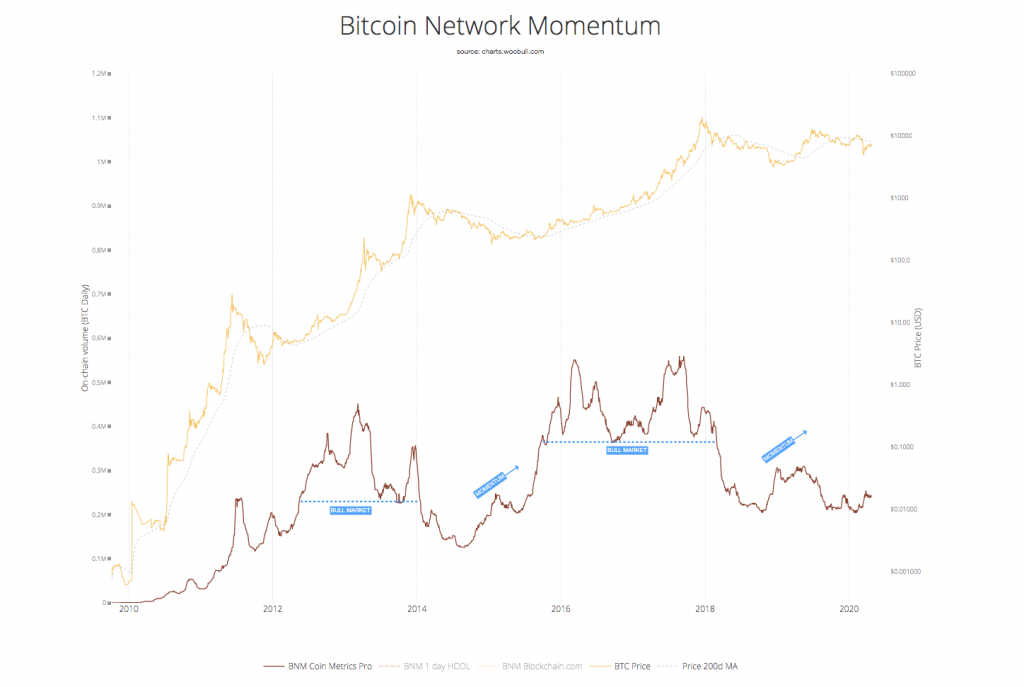
Bitcoin Network Momentum is another simple chart to see where Bitcoin price is at, without looking at candlesticks all day.
Bitcoin Network Momentum is a view created by Philip Swift aka Positive Crypto which looks into the value transmitted through the Bitcoin blockchain, denominated in BTC value plotted against Bitcoin’s price. It serves as a leading indicator of Bitcoin bull markets.
Sufficiently high levels of value throughput is needed drive bull markets. As you can see, I got lucky and bought my first bitcoin at the beginning of a new bull cycle back in end 2015. But I did not learn how to read chart and missing out on selling at the peak to take profits.
2020 Price Prediction?
As with any market, nothing is for sure. Throughout its history, Bitcoin has generally increased in value at a very fast pace, followed by a slow, steady downfall until it stabilizes.
There are plenty of charts out there, like the Bitcoin difficulty ribbon, Golden ratio multiplier, Super Gubby. Depending if you are a day trader, value investor or a HODLer, you will need difference tools for difference time frames and target. So take whichever charts that you may.
Bitcoin is only a baby right now with around 150 billion dollars market cap, compare to gold is 9 trillion market cap, facebook is roughly 500 billion.
I have made a blog about when you look at how the Feds is printing billions of paper money every day to flood the market, how it may affect the fiat dollar and driving further economy collapse. If a small percentage of this new money goes into Bitcoin, I won’t be surprise to see Bitcoin continue to increase like it has been for the last 10 years.Bitcoin is so small and under the raider, that’s why you still don’t hear it often on the street.
Global chaos is generally seen as beneficial to Bitcoin’s price since Bitcoin is decentralized, borderless and sits outside the control or influence of any particulate government.
When thinking about how economics and politics will affect Bitcoin’s price, it’s important to think on a global scale and not just about what’s happening in a single country.
I think Bitcoin has a lot more room to grow, probably another 100x in the next few Bitcoin halving cycles.
For more information about Bitcoin Halving 2020, you can watch my full video on Youtube or you can e-mail me at lowinab@gmail.com